AFib detector v1 on 12-lead ECG
A five-class rhythm classifier reaches 0.921 F1 for atrial fibrillation on a held-out test set of 4,211 recordings.
This is a sample page. It shows how a results write-up renders: tables, plots, formulas, code and downloadable data. The methods subpage explains how the data was prepared.
Setup
The model classifies 10-second, 500 Hz, 12-lead recordings into five rhythm classes:
- NSR, normal sinus rhythm
- AFib, atrial fibrillation
- AFL, atrial flutter
- PVC, premature ventricular contractions
- Other, every remaining rhythm
Recordings were split by patient, so no patient appears in both training and test data.
Metrics
Sensitivity and positive predictive value are computed per class, one class against the rest:
| Class | Support | Sensitivity | PPV | F1 | AUC |
|---|---|---|---|---|---|
| NSR | 1980 | 0.966 | 0.962 | 0.964 | 0.987 |
| AFib | 910 | 0.925 | 0.916 | 0.921 | 0.962 |
| AFL | 216 | 0.815 | 0.834 | 0.824 | 0.931 |
| PVC | 411 | 0.944 | 0.926 | 0.935 | 0.978 |
| Other | 694 | 0.880 | 0.905 | 0.893 | 0.905 |
Download the per-class metrics as CSV.
Confusion matrix
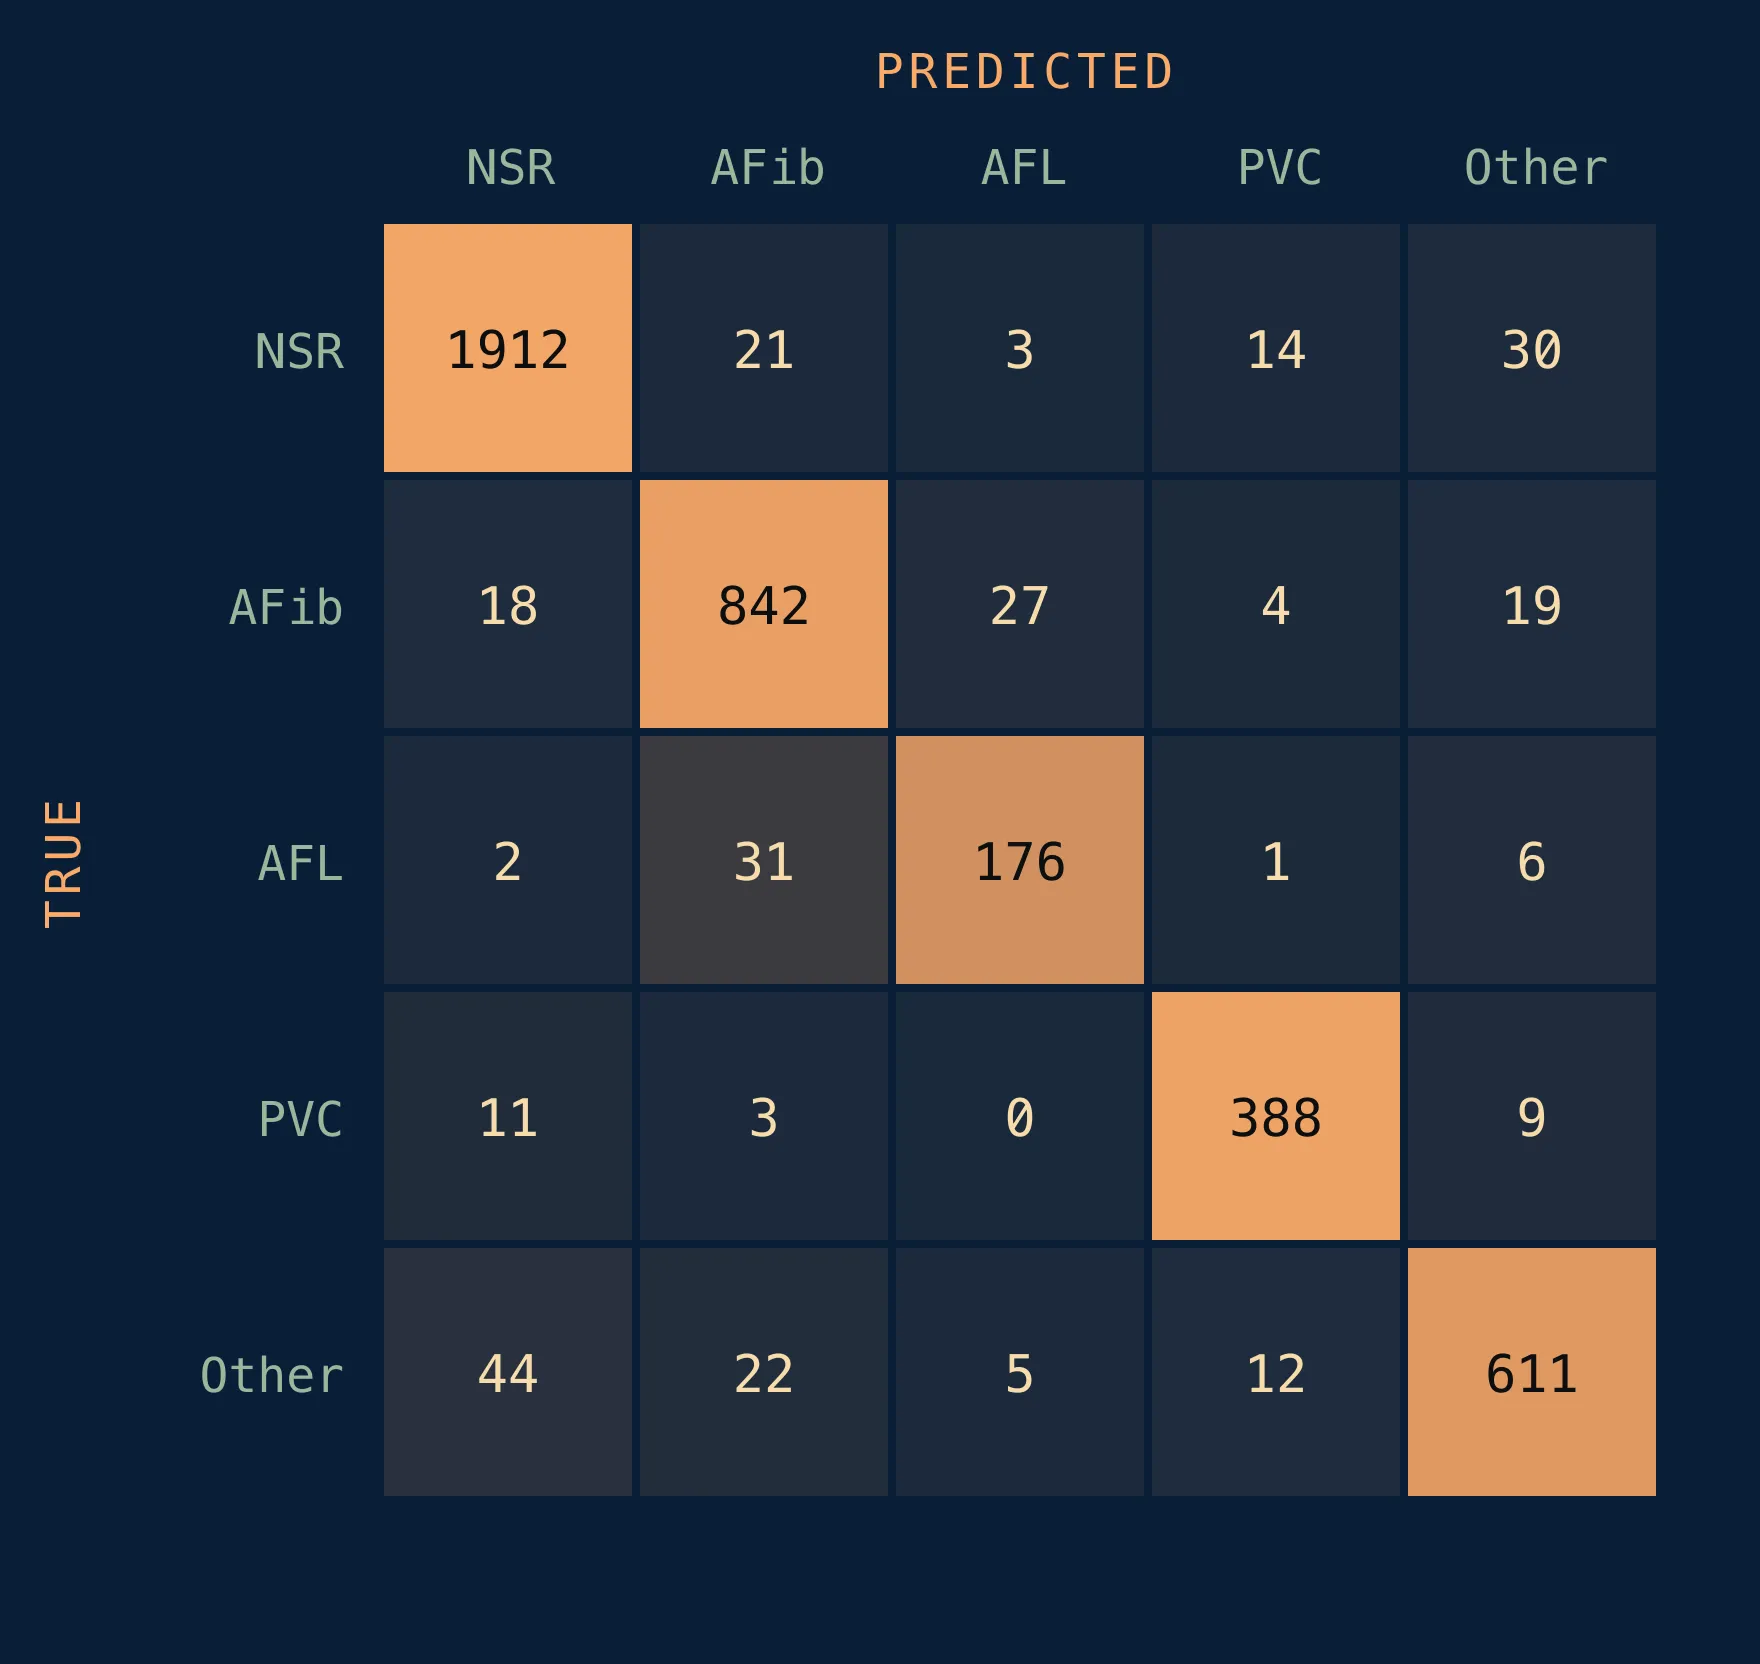
Most AFL errors are predicted as AFib. The two rhythms share irregular atrial activity, and flutter waves are hard to see in short strips.
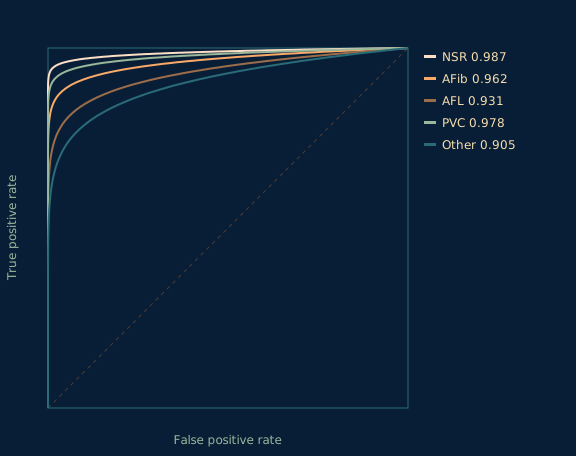
ROC curves
Reproducing
from ecg_algo import load_model, evaluate

model = load_model("afib-detector", version="1.0.0")
report = evaluate(model, split="test", sample_rate=500)
print(report.per_class[["sensitivity", "ppv", "f1"]])
Next steps
- Patient-level split
- Add 1-lead wearable recordings
- Calibrate thresholds per class1
Footnotes
-
Thresholds are currently the argmax of the softmax output, with no per-class tuning. ↩
In this section
Methods
Data preparation, preprocessing and the signal quality gate.
Detailed results
Breakdowns of the headline numbers.